Tuesday, December 19, 2017

Python version problems.


Python version problems

Different versions of Python have enough differences to be troublesome.

Version 2.7.4 calculations use implicit integer types where version 3.6.0 uses implicit float types.
The following examples illustrate the problem:
V2: 7/5=1; -7/5= -2
V3: 7/5=1.4;-7/5= -1.4
Adding a decimal to numbers in V2 converts them to floats:
V2: 7.0/5=1.4
A manual conversion also works:
V2 float(7)/5=1.4

The problem, for me, is version 2.7.4 has the ephemeris module installed. In the computer’s Raspbian operating system, version 2.4 is installed and installing version 3.6 has to be without modules. Hence, the ephemeris module will be absent with 3.6.0. Again, the problem? Different scripts are written with different versions of Python. One or two large sophisticated programs require simultaneous versions of Python.
I decided to use my translation of an Excel spreadsheet instead of the ephemeris. Only version 3.6.0 is required and is summoned with:
“python3.6 NOAA.py”
My calculations of solar incident and solar module irradiation are compatible with version 3.6.0.


Wednesday, December 13, 2017

An instance of translation from Excel to Python.

This is an instance of the translation of an Excel spreadsheet formula into the Python equivalent.


EXCEL:
#AH2=Sun Azimuth degrees clockwise from North
=IF(AC2>0,MOD(DEGREES(ACOS(((SIN(RADIANS(Lat))*COS(RADIANS(AD2)))-SIN(RADIANS(T2)))/(COS(RADIANS(Lat))*SIN(RADIANS(AD2)))))+180,360),MOD(540-DEGREES(ACOS(((SIN(RADIANS(Lat))*COS(RADIANS(AD2)))-SIN(RADIANS(T2)))/(COS(RADIANS(Lat))*SIN(RADIANS(AD2))))),360))


PYTHON:
#AH2=Sun Azimuth degrees clockwise from North
AH2a1=math.acos(((math.sin((B3/r)) * math.cos((AD2/r))) - math.sin((T2/r))) / ((math.cos((B3/r)) * math.sin(AD2/r))))*r + 180
AH2b1=360
AH2a2=540-math.acos(((math.sin(B3/r)*math.cos(AD2/r))-math.sin(T2/r))/((math.cos(B3/r)*math.sin(AD2/r))))*r
AH2b2=AH2b1
if AC2 > 0 : AH2=AH2a1-int(AH2a1/AH2b1)*AH2b1
else : AH2=AH2a2-int(AH2a2/AH2b2)*AH2b2

Tuesday, December 12, 2017

NOAA equations for solar data (sunrise, sunset, elevation, azimuth, Julian Day, Equation of Time, etc..


   In a recent post I presented the equation for energy incident on a solar panel (Sm).
Here I present the set of equations used to calculate sunrise, sunset, and solar elevation and azimuth.

=============================================================

#This particular set was extracted from an Excel spreadsheet made available by NOAA.

#360 deg/2*pi=57.29578
#if in radians, do sin(x/r) to get degrees
#sin(45d)=.7071
#sin(45r)=0.8509

LT: Local Tiime
UT:Universal Time
TZ:Time Zone
LT=UT+TZ

JDg1=367*Y-int(7*(Y+int((M+9)/12))/4)-int(3*(int((Y+(M-9)/7)/100)+1)/4)+int(275*M/9)+D+1721028.5+UT/24
JDg2=367*Y-int(7*(Y+int((M+9)/12))/4)+int(275*M/9)+D+1721013.5+UT/24

#For the Day:
#B3=Latitude, + to N
#B4=Longitude + to E
#B5=Time Zone + to E    ( calculations use TZ)
#B7=Date
#H=Blank
#--------------------------

#D2=date
=date, mm/dd/yyyy , Calculations use JD

#E2=T past local midnight (used in TST and Elev refraction calc)
#sum of 0.1/24 from midnight to current with .1/24 increments (fraction of the day in tenths of an hour ; 6 min = 0.0041666 day)
=LT/24
# In the JD, the previous day +.5 is midnight since the calendar sarts at noon.
#F2=Julian Day
=D2+2415018.5+E2-TimeZone(TZ)/24
JDg2=D2+2415018.5+E2-TimeZone(TZ)/24


#G=Julian , used in other functions, translated into radians. Functions that make up S and T use G (P,R,Q).
=(F2-2451545)/36525

#H=Blank

#I=Geom Mean Long Sun
=MOD(280.46646+G2*(36000.76983+G2*0.0003032),360)
#mod()=a-int(a/b)*b

#J=Geometric Mean Anomaly of the Sun
=357.52911+G2*(35999.05029-0.0001537*G2)

#K=Eccentricity of Earth orbit
=0.016708634-G2*(0.000042037+0.0000001267*G2)

#L=Sun Eq of Ctr
=SIN(RADIANS(J2))*(1.914602-G2*(0.004817+0.000014*G2))+SIN(RADIANS(2*J2))*(0.019993-0.000101*G2)+SIN(RADIANS(3*J2))*0.000289

#M=Sun True Long degrees
=I2+L2

#N=Sun True Anomaly degrees
=J2+L2

#O=Sun Radius Vector, A.U.
=(1.000001018*(1-K2*K2))/(1+K2*COS(RADIANS(N2)))

#P=Sun Apparent Long
=M2-0.00569-0.00478*SIN(RADIANS(125.04-1934.136*G2))

#Q=Mean Oblique Ecliptic degrees
=23+(26+((21.448-G2*(46.815+G2*(0.00059-G2*0.001813))))/60)/60

#R=Oblique Correction factor
=Q2+0.00256*COS(RADIANS(125.04-1934.136*G2))

#S=Right Ascension degrees
=DEGREES(ATAN2(COS(RADIANS(P2)),COS(RADIANS(R2))*SIN(RADIANS(P2))))

#T=Declination in degrees
=DEGREES(ASIN(SIN(RADIANS(R2))*SIN(RADIANS(P2))))

#U=var y
=TAN(RADIANS(R2/2))*TAN(RADIANS(R2/2))

#V=EoT minutes
=4*DEGREES(U2*SIN(2*RADIANS(I2))-2*K2*SIN(RADIANS(J2))+4*K2*U2*SIN(RADIANS(J2))*COS(2*RADIANS(I2))-0.5*U2*U2*SIN(4*RADIANS(I2))-1.25*K2*K2*SIN(2*RADIANS(J2)))

#W=HA Sunrise degrees
=DEGREES(ACOS(COS(RADIANS(90.833))/(COS(RADIANS(Lat))*COS(RADIANS(T2)))-TAN(RADIANS(Lat))*TAN(RADIANS(T2))))

#X=Sun noon LST
=(720-4*Lon-V2+TZ*60)/1440

#Y=Sunrise time
#Y=Sunrise time
Y2=X-W*4/1440
#Z=Sunset time
Z2=X+W*4/1440

#AA2=Sunlight duration
=8*W2

#AB2=TST
=MOD(E2*1440+V2+4*Lon-60*TZ,1440)

#AC2=Hour Angle
=IF(AB2/4<0,AB2/4+180,AB2/4-180)

#AD2=Zenith
=DEGREES(ACOS(SIN(RADIANS(Lat))*SIN(RADIANS(T2))+COS(RADIANS(Lat))*COS(RADIANS(T2))*COS(RADIANS(AC2))))

#AE2= Sun elevation in degrees
90-AD2

#AF2=Atmospheric refraction un degrees
=IF(AE2>85,0,IF(AE2>5,58.1/TAN(RADIANS(AE2))-0.07/POWER(TAN(RADIANS(AE2)),3)+0.000086/POWER(TAN(RADIANS(AE2)),5),IF(AE2>-0.575,1735+AE2*(-518.2+AE2*(103.4+AE2*(-12.79+AE2*0.711))),-20.772/TAN(RADIANS(AE2)))))/3600

#AG2=Sun Elevation corrected for refraction
=AE2+AF2

#AH2=Sun Azimuth degrees clockwise from North
=IF(AC2>0,MOD(DEGREES(ACOS(((SIN(RADIANS(Lat))*COS(RADIANS(AD2)))-SIN(RADIANS(T2)))/(COS(RADIANS(Lat))*SIN(RADIANS(AD2)))))+180,360),MOD(540-DEGREES(ACOS(((SIN(RADIANS(Lat))*COS(RADIANS(AD2)))-SIN(RADIANS(T2)))/(COS(RADIANS(Lat))*SIN(RADIANS(AD2))))),360))


=====================================================================


Friday, December 1, 2017

Linear actuator installed. Possible changes.


   I've been building my power station with n eye to minimizing the cost without sacrificing quality.
I've mounted the array on a one inch steel pipe leaning against an  aluminum ladder. The ladder was damaged beyond intended use, so I've re-purposed the ladder, for the time being, as a support frame for the array. I drilled holes to mount a piece of wood to strengthen the weak area. I also drilled holes to attach the linear actuator. I've mounted the linear actuator in the first trial position. The actuator is a heavy duty, hazardous environment, model suitable for outdoors, all season use. The unit can push or pull 10 kN, or 10000 N. That is equivalent to 2,200 pounds, or, a little over one ton (2000 lbs). The unit is working with a small load which will drain little power from the battery bank, even on a cloudy day.
   I will be able to program the tracking to follow the sun using calculations, mm/rpm specs from the manufacturer, and a solar detector composed of four small solar cells attached to the array. If the day is cloudy, the sensor will respond with characteristic data that can be responded to in program.
   The motor power wiring has to be run from the indoor station to the unit unless the control computer is mounted near the array in a weather proof box.
   The idea of moving the entire station out to the array is appealing. The problem I have is the battery bank. What is the effect of low temperatures on flooded lead-acid batteries? My first thought is to build an enclosure big enough to insulate. The minicomputer I'm using was not necessarily designed for harsh environments, though electronic circuitry tends to be very hardy. There is a more utilitarian version of the computer that may be a better choice. I may place the mini computer and charge controller at the array and keep the battery bank and inverter indoors. That makes powering the mini computer an issue. The unit is currently powered by the battery bank. Running DC power lines to the array for the unit seems impractical. A smaller battery dedicated to the mini computer would be a better choice. In fact, I have a left over charge controller and inverter that could supply the unit. A small solar panel could be added to the array specifically for the computer. The mini computer, RPi, typically uses onlly 5 watts of power and that makes powering the unit inexpensive and simple.
   The charge controller is a Zantrex 60A PWM model. The inverter is a 300 watt pure sine wave type. Add a small battery and a solar panel and the parts list is complete.
   The second power supply will, like the RPi, need to be enclosed in a weatherproof container.
   The mini computer is a Raspberry Pi 3B with USB ports, WiFi, and GPIO ports. Software installed includes the Apache web server, PHP, Python, an RTL hardware clock driver, a USB driver for the charge controller, WiFi access point software, and a small 16Gb SD card and reader.


Friday, November 24, 2017

Eclipse graph


   I posted I would present the graph for the day of the partial solar eclipse (northeast Tennessee) for interest. The data was collected on a clear day with a few short intrusions. The time was still Daylight Savings Time.


Data predictions


   Predicting the amount of solar energy that can be collected is useful. Steps can be taken to prepare for low or high energy days.
   There are several publicly available databases of historical weather data as well as at least one that publishes data based on a mathematical model.
   Days that are statistically more likely to be cloudy or overcast can be anticipated with a measured level of reliability The likelihood of a likelihood.
   A comparison of the historical data and real time current data can be interesting.

   My first attempt to describe the data I collected using a graphic curve were based on best-fit-polynomial equations. In my case, I used spreadsheet software for this. The best curve to be had was with a two term polynomial. There was no benefit to increasing the number of terms.


   The results were not satisfactory. I began looking for an improved method. I was familiar with several websites that make solar cell/panel/array information available. PVEducation.org is a site that has more information any other I examined, which not to say there isn't one with more. I began perusing the site. I discovered mathamatical equations for several Sun and cell related phenomenon.

   I used the formulas for solar radiation orthogonal to, and incident to, a cell. That equation was incorporated into the equation for the effective solar radiation at a given tilt and angle and included the effects of air mass, refraction, and the curvature of the Earth's surface.


   The difference between the suggested curve and the curve of prediction in the above image, is due to limitations on charging current for the battery bank, by the MPPT controller's designers. A limit of about 2.5 amperes is placed on charging the batteries. This results in a loss of efficiency in terms of the amount of energy available. Where 585 watts is available, only 260 watts is typically used, maximum.

   The battery type I use is the deep cycle, flooded lead-acid type.The suggested charging current is 2.5 amperes:

10%-13% of the C20 rating which is, in this case, 108Ahr.
10% of 108Ahr = 10.8 amperes
13% of 108Ahr is 14.04 amperes
2.3% of 108Ahr is 2.5 amperes, the esuggested rate used by the controller's designers.

   A low charge rate is said to correlate with a longer battery life while a higher charge rate correlates with a shorter battery life. There is a trade-off for the lifetime of the battery and the convenience of energy availability. More batteries must be added for a low charge rate to achieve the availability goals. The cost of more batteries may cancel out the shorter lifetime caused by higher charge rates.
   The issue seems to become one of pay now or pay later, the end cost will not be much different. This is presumptuous. I do not have enough data about the effects of charge rates on deep cycle lead-acid batteries. The choice is open.
 

Seasonal changes in the solar path.


   Previously, I posted the impracticality of sensing resistors in a solar arry. I've decided that such sensors are needed. I do not have any of the design details of the MPPT controller I'm using, but I suspect the device is not up to parr with the rest of the system. A sensing resistor in series with the mainline will let me verify the power transfers taking place in the system. A small ADC board will convert analog data into computer compatible, digital data. I have all the parts and software on hand.

   If knowing the details of the panel system were crucial, I could insert a series of relays into the circuitry and a digital switching system to isolate each component in turn. Doing the same for the battery system would make SoC data available. I could then implement any of a series of algorithms.

   I stated in the last post, I would publish a series of graphs illustrating the seasonal changes in the amount of sunlight available. I do that here. First, I'll preface that series with a discussion of the variables involved.

   Throughout the year, the Sun's path through the sky changes. On June 21st, the Sun is closest to the Earth and highest in the sky at noon. On December 21, the Sun is farthest from the Earth and lowest in the sky at noon. Visualize an arc in the sky. The arc sinks lower as the days pass, until the lowest point occurs in December, then begins to rise till June, when the highest point is reached. This arc represents the path of the Sun throughout the day.

   One of the results is the lengthening of shadows in Winter. Since the Sun is lower in the sky at noon, the shadows will be longer. In Summer, the Sun is highest in the sky and the shadows will be shortest. What this means to me, is that solar energy is least when needed most, and most abundant, when needed least. For this reason, a system needs to be designed for Winter, the low energy months.

Note, in particular, the difference between the first, June 3, and the last, October 31. The difference is the effect of a changing solar path and shadows. Also note that most of the images were constructed from data collected on a clear day.

Here are the graphs:


Timelapse shadow study

November 24, 2017

This is a cellphone (Apple iPhone 4) timelapse video of the area of my yard of interest. The region of least shadow, and therefore most sun, is easily determined. The iPhone phone 4 has a lower resolution imagery, but I'm not interested in details in this video and the file size and screen size are ideal for a blog like this.

.
I include a couple of graphs of the before-and-after type as illustrations. I've included a graph for the day of the eclipse as an interesting example.


The above image is the 'before' shot. Half my solar day is lost due to obstructions. October 30, 2017.


This image is the 'after' shot. I've recovered a great deal of the lost energy. November 23, 2017.

I'll post a page on the changes in available sunlight throughout the year, next.

Wednesday, November 22, 2017

Mathematical equations and charting


Some things have happened since the last post.

   I found an equation for the irradiation on a solar panel. The equation takes into account air mass, refraction and the curvature of the earth's surface. I translated the math into the Python programming language I've been using and now collect that data along with the rest.
   By adding historical data in the form of averages, I can make a reasonable prediction of the amount of irradiation on a clear day.
   I located an extensive set of equations for determining the position of the sun. They are from the NOAA SPA set. I'm translating the Excel format of the equations into the Python format. I've been using a ephemeris programming library to do those calculations but decided to do them myself as an exersize.
   I used a cellphone to record shadow activity in the back yard. I studied the results and moved the array to a new location. Half of my solar day was lost to shading by trees on an adjacent lot. There's some shading in the new spot, but not quite as much. I will move the array to an area with the maximum exposure after adding some wire to the station. I need to add another fifteen to twenty feet to the line from my house to the array.
   I've redesigned the station and am going to add a linear actuator and PWM power supply. I'm going to split the array up. Three panels will be mounted on a steel pipe tilted at an optimum 45 degree angle. The actuator will rotate the array by rotating the pole on which they are mounted. I will double the amount of energy I collect using the shade-free site and one-dimensional tracking using the linear actuator.
   Two panels will be used as an adjunct. The manufacturer of the MPPT controller I've been using states the charger is limited to charging batteries unless in the float stage. Only then can excess be bled off into a real-time system, e.g. laptop, web router and modem, coffee grinder, pumps, etc.. The manufacturer of the MPPT controller has set the maximum charge rate for the bank at a level equal to the energy supplied by only three panels.
   I have an older Xantrex PWM charger/controller That will supply ongoing needs while the 36VDC system's primary function remains charging the 5KW battery bank. I'll add a couple of smaller (8AHr) batteries to stabilize the Xantrex output. Those batteries will act as capacitors to filter the PWM output of the Xantrex. The Xantrex takes a 24VDC input. That leaves one 12VDC panel which will be used to run12VDC devices such as the 12VDC battery charger for a 18VDC reciprocating saw battery.


Sunday, April 2, 2017

Sensing resistors are impractical

After additional research on the circuit model for solar cells and panels and the characteristics of panels in series-parallel arrays, I've decided the use of more than one sensing resistor is impractical unless a major electronic design change is made.

Panels in series have a voltage that is the sum of the individual voltages and a current equivalent to the smallest current. If several panels are in series and all but one have current of ten amps, and the remaining panel has a current of eight amps, the string current will be eight amps.

Panels in parallel have a voltage equal to the average of all the individual voltages and a total current equal to the sum of individual currents.

Placing all panels in parallel will allow measuring the individual currents but the charge controller requires three times the voltage for optimum performance, hence the series connection.

A electro-mechanical, or solid state, switch/relay could be placed in series with each panel and each panel electrically isolated in turn, for measurement. This would take a few milliseconds. The need for the data does not warrant such a step. Panels generally carry an industry wide warranty of twenty five years with derating. I may use one sensing resistor for the array in its entirety to check on the accuracy of the charge controller and as a general indicator of the array's status.

The equivalent circuit for a solar cell:


Wednesday, March 1, 2017

Sensing resistor calculations; solar energy variation

   As a precursor, let me reiterate, these blogs are for intelligent people with a university background and courses in mathematics, engineering, physics and other of the hard sciences.

   The use of a charge controller, generally, obviates the need for blocking diodes, but not always.
Their installation is a safety measure.
   Along with blocking diodes, bypass diodes need to be installed. Bypass diodes allow energy to flow around panels in series-parallel. If one panel in a string gets shaded, the diodes allow energy to flow around the panel, leaving the other panels in the string operational. If three panels are connected in series, and there are several such strings connected in parallel, shade can reduce the output of an entire string when only one panel is shaded.
   Current sensing resistors allow detection and measurement of each panels output. They serve to measure and verify the efficiency of the charge controller. An additional wire also lets the voltage be measured for each panel and the power can then be calculated.
   Knowing what's going on with each panel, and not just the array as a whole, improves safety and reliability. If a panel starts dropping in power under full sun, then operator can do a manual inspection for stray objects, leaves, or snow. If no objects are responsible, then the panel is wearing out or going bad and needs to be replaced. Each panel varies from specifications to some degree. Panels can be better matched if their real parameters can be measured.
   The current sensing resistors used need to be of a very low value. A value less than one is common. In my case, i'll be using 0.01 ohm 5 watt resistors. The maximum current for the type of panels I'm using is around 8 amps. The typical power output for a fully illuminated panel is 100 watts at 12 vdc. The resistor power rating can be calculated : 8 amps x 0.01 ohm = 0.08vdc. And 0.08vdc x 0.08 amps is 0.64 watts. My choice of 5 watt resistors will allow me to use the same resistor for an overall measure of the array output of about 600 watts. The array is composed of two parallel strings of three panels, in series, each, for an array voltage of 36 vdc. Two parallel strings results in a typical current of 8 amps per string, therefore, 16 amps for the array as a whole. Given 16 amps x 0.01 ohms, the power dissipated is calculated: 16 amps x 0.01 ohms =  0.16volts; 0.16 vdc x 16 amps = 2.56 watts, leaving enough headroom to insure the resistor does not burn up during surges.
   The output of a solar panel will vary throughout the year since the highest position of the sun in the sky during the day, changes with the seasons. My array is at a geographic latitude of 36.34 degrees. This means the sun will never be directly overhead, and therefore, at its hottest. The energy of the sun's rays is reduced by the atmosphere and the light has to pass through more atmosphere when the sun illuminates the panels from an angle. The amount of atmosphere the light rays pass through is least when the sun is directly overhead. The adjustment of the position of the panels with respect to the sun, ameliorates the effect to some degree. The effect of the combination of incident light angles for the sun and the panel can be minimized. The only way to reduce the effect of the sun's lower zenith in winter, is to move to the equator. Even then, the sun is further from the earth and that, too, will reduce the intensity of the sun's rays. If the nutations of the earth are taken into account, the sun will, still not reach a point directly overhead at thie latitude mentioned.


Thursday, February 23, 2017

Remote RPi and power supply

   I received a buck converter in the post today. The unit has a 17vdc range input and a regulated 5vdc output. The unit will allow me to place the Raspberry Pi outdoors and use a sealed lead-acid battery as power source for day and overnight operation. The battery will have a Xantrex PWM 50W charge controller charging the battery from a single solar panel dedicated to powering the RPi, alone.
   The RPi has a micro-B USB connector that is used for power input connection. I will take a matching connector and attach the other end to the buck converter.
   A buck converter is a voltage converter that drops and input voltage to a lower level. A boost converter is a voltage converter that raises an input voltage level to a higher level.
   The RPi is mounted on a circuit board along with a couple of  other devices.

Monday, February 20, 2017

Sample graph chart produced by software

   Here is a sample chart created by my software in the form of a webpage in HTML and javascript.
   Click on the image for a full size view.
   This is of the current data for February 20 2017 up to about 2:00PM.
Note the PV power never reaches the 600W potential for the array, but hovers around 350W, maximum.


Just click for a view of a full size image.

Tracking and angles

One of the most unused options in residential solar power stations is the concept of tracking. A solar panel array can be mounted in such a way as to be adjustable. An adjustable array can have it's position adjusted periodically, to follow the sun, resulting the maximum exposure of the array to the sun's light/radiation. If an array is fixed in position, there will be one period in the day when the amount of power generated will be greatest. Before and after, the power will grow or decay with decreasing exposure. When sunlight shines on a panel at an angle, there is less energy than when illuminated from a position directly above the panel. Tracking positions the array so the sun is directly above the array and not at an angle off to one side.
   One of the major obstacles to tracking is mounting technology. There is no shortage or difficulty in acquiring the electronics or software use in tracking. Placing an array high in the air and on pivoting points is difficult since most hardware for the task is not in the hands of the consumer. Companies that specialize in medium to large installations can install such a system, but the cost is usually much more that the average consumer can afford. Retail, turn-key solar power stations are not cheap. My knowledge and experience in electronic engineering and advanced mathematics gives me an edge in such a pursuit. I can find out what I don't know and need to, then learn. Slow, maybe, but successful.
   My background in personal computing devices and programming has prepared me for the task of assembling or writing software and hardware for the task. Like anyone else, however, I'm stumped when it comes to mounting an array for tracking. I've considered many, many possibilities, both conventional, and not. For example, I considered finding the largest automotive universal  joint possible (think Hum-V or tractor trailor, possibly a tank) and using that as my primary pivot point.
   I also considered a popular option version used by installation companies based on worm gears or slew drives. Affordable and accessible by the consumer. The steel pipe/post which holds those devices is another matter. The closest I've come to locating that resource is one of the basketball posts found in many school yards or church yards. A steel pipe is mounted on another piece of pipe embedded in concrete and having a flange welded/molded to the top. The flange is circular and has several bolt holes to match with a similar flange on the bottom of the pipe with the basketball goal.
   The approach I finally decided on uses a device known as a linear actuator, effectively, a motorized arm. The unit resembles the pneumatic lift in the rear hatch of a hatchback automobile or the shock absorber in a car. The one I picked is designed for use in rugged conditions, including outdoors, and can push or pull 10,000 Newtons. That's approximately one ton. The array consists of 6-12 solar panels of about 20 lbs. each, two steel struts about 20 lbs each and a steel pipe about 20 lbs. Eventually, the array will weigh about three or four hundred pounds. Fortunately, the linear actuator will only have to push/pull the vertical vector from a 45 degree angled array. This means that only part of the weight of the array will need to be accommodated by the actuator. The linear actuator rod extends/retracts ten inches. The unit will have to be placed close enough to the center of the array that the ten inch push/pull will result in a change in angle of the array of at least 120 degrees. That will be close to the center. Given the closeness of the position, the force required to move the array will be greater than if the rod extended longer and could be placed further from the center of the array.
   The array can track the sun using one or both of two methods: sensor detection of the sun; and calculated sun position. The expected position of the sun at a given date and time can be calculated and used to position the array. Small solar cells, about an inch or more in size, can be used to detect the sun's position by the comparison of the power produced by each of the cells when they are mounted at relative positions corresponding to a cross. One high, one low, one left, and one right of center and mounted on the array to increase reliability and accuracy.
   One can serve as a check or verification of the other.
   The amount of energy acquired by tracking, compared to a fixed, unmoving array is worth the extra cost and work.
   Currently, I have 600W in six panels that produce only 350W at sun's highest point at my latitude (something else to consider when setting up an array). The time of year is the middle of winter, so the sun does not rise very high in the sky, and is never directly overhead, even in summer, due to the effect of latitude. By tracking the sun, I can point the array directly at the sun in the morning and keep the array pointed at the sun throughout the day. This will move my solar power production closer to the 600W@10hours per day I can achieve.

Friday, February 17, 2017

Software continued

   Among the difficulties encountered, are the coordination of tasks among several different languages. The timeline begins with data being read from hardware, a file is opened and the data written to the file. The file name is taken from the current date, the reasoning is, the current date constitutes a unique identifier that insures no two files will have the same name. The script reading the data is initiated by a service script used by the computer operating system to schedule tasks. The 'service' calls the data reader script. That script runs another script that gets the calculated solar azimuth and elevation for the current time. There is an option in that script to get previous and next sunrise and sunset times used in setting the schedule. A service timer script may eventually be used instead of rise and set times. The azimuth and elevation data are written to the opened data file along with the hardware derived data. The data reader also calls another script that creates a webpage that gives a brief overview of the station's current activity. Another webpage, pre-written, opens the day's data file and draws a line graph chart based on that data. Two data reader scrips/services run simultaneously. One collects all 22 variables every 30 seconds. The other collects four variables' data. The latter is the brief form and is the one from which the line graph is drawn.
   All of this is done with several scripts and 5 languages. An additional modification will create a permanent image of the line graph chart for long term storage, a snapshot of that day's activity.
   With all of this, there still remains the programming of the linear actuator(s) that will position the array for maximum exposure to the sun. Some improvements in the area of charting and data storage may be in the future. The computer uses a 16gb SD card for main storage. A packing program could reduce the amount of storage space used by the accumulating data files, by 80%. The amount of storage space used by, even a year's, data, is so small as to make the amount almost negligible.

   Changes made in the computer include downloading and installing many programs. The computer is programmed for wi-fi, both as a client, and as a server. This makes remote collection of accumulated data easier than going to the station and physically hooking a laptop or other device, to the computer to get the files. The languages have to be installed. Programs associated with several pieces of externally added hardware have to be installed and configured.  Periodic tests have to be run during the computer setup to insure each program is installed correctly, before moving on to the next stage. One mis-configured application can cause, seemingly, mysterious problems later on.
   Once the computer is setup, a system test is needed to make sure everything is running together smoothly. Hardware tests improve reliability. Among the additional hardware are the analog-to-digital converters that convert voltage and current readings to the binary language usable by computers. The current sensing resistors, bypass diodes, sun sensor cells, fuses/breakers, all have to be tested and calibrated.

Wednesday, February 1, 2017

Software

   I've been working with the software.  I use a combination of PHP, Python, Bash, and HTML-javascript.
The reason for so many languages is some things are done more easily in one language than another. Python is better with the hardware end of things and PHP is better with the web and HTML/Javascript.
The situation is:
   A bash script run as a systemd service/daemon calls a PHP script which collects data from the hardware, namely, the charge controller charging the batteries using energy from the solar array. The charge controller contains a UART that performs communications tasks with the external world. The PHP script calls a Python script to calculate astronomical data for determining the current location of the sun by calculation. The PHP script then modifies the data and stores the end product in a file along with data to be plaotted, from the charge controller. A HTML file runs Javascripts to open the data file and read the contents. A chart is then drawn on the web page and a line of the activity of several variables, is plotted. The chart is a real time data provider.
   The plot is updated each minute with additional data. Another Python script calculates the times for sunrise and sunset and uses that information to run the data collection process between sunrise and sunset, and suspend data collection and storage from the hardware.
   The charge controller hardware collects data 24/7 using a UART to communicate in RS-485 protocol with a RJ45 connector plugged into the Raspberry Pi's USB port using a RJ-45 to USB cable.
   A hardware clock module has been added to the Raspberry Pi (RPi) to maintain accurate and consistent, system time. The module uses a small lithium battery to maintain settings storage during times when the RPi is shutdown (off). The battery will run down, though, if left un-refreshed long enough. I need to add a larger lithium battery. I have one from an old iPhone that should last several weeks, if not months, offline.
   I'm going to add sensing resistors in the return loop ( in the case of the Chinese charge controller, the positive line). This will allow me to keep a separate record of the detailed activity of the solar array. A side benefit exists of allowing me to examine the efficiency of the charge controller. The controller uses the positive line for ground return. This is not the way most Western systems are configured. This will work since the inverter output is lfoting (unugrounded). Without grounding, both lines from the array float about 16vdc above ground. This is more than the Analog to Digital converters I will be using can stand. When I ground the positive line of the arry, The differentials, less than 1 vdc, will be close to ground (0vdc) and easy to measure with a voltage divider on the ADC inputs.
   The charge controller uses a mathematical algorithm to estimate the state of charge of the battery bank. I will be able to determine if I need to find a better device.
   Eventually, I will move all of the electronics outside and into a weatherproof container, including one or more small batteries for the RPi. I will use a buck converter to convert the 12 volts D.C. from the batteries to the 5 volts D.C. needed by the RPi.
   A linear actuator will rotate the array to a position optimum for collecting solar energy. Relays will be programmed by the RPi to engage the actuator motor. The actuator is capable of moving 10,000 Newtons, or about one ton. The array will weigh about 500 pounds and have 12 panels mounted on a steel pipe  using something similar to U-bolts. The 'tracking' will be in two dimensions at first, and later, in three.

Saturday, January 21, 2017

The Solar Path Chart


Sun path chart
Solar Path Chart

   One of the tools a solar power station designer needs is a solar path chart. The chart makes the azimuth and elevation of the sun, at any hour, on any day, available. The highest point is the summer solstice and the lowest is the winter solstice. The length of an arc indicates the length of the day for that date. The highest point of an arc is the high point of the sun on that day.

Sensing current in the array


I inserted a sensing resistor in the ground return loop of the array. I attempted to feed the RPi the signal using an adc(analog-to-digital-converter). What I hadn't anticipated is the shift in the ground reference.
By definition, ground is a zero point. Mathematicall, ground is 0volts. The charge controller feeds the battery bank and the inverter. The inverter 110VAC feeds the RPi through a 110VAC-to-5VDC converter/power supply. The RPi ground turns out to be 16+VDC above the RPi ground. I blew out an expander card, which I really didn't use, and the ADS1115 adc. I have several adc's and will use another one.
   I spent some time considering solutions to the problem. I ordered a couple of AD620 instrumentation amplifiers with a maximum supply range of 18VDC. These will produce the difference between the ends of the sensing resistor which is typically around 0.5VDC. Until the AD620's arrive, I'm going to use a resistor network to attenuate the signal to a level compatible with the ADS1115, 6VDC maximum.
   The resistors will be high impedence and have negligible effect on the signal. The signal will be reduced to 20% of the original, about 3.5VDC, That will be fed into a ADS1115 setup for differential input.
   The solution may need system grounding. The panels may need to be grounding, especially since the house is wired conventionally with an earth ground. The charge controller has a positive ground and that makes matters a little less simple.

The Raspberry Pi - monitor and control


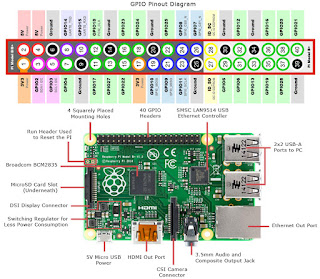
The  picture accompanying this article portrays a Raspberry Pi model 3B SOC(system on a  card).
The Pi is a full fledged computer with wi-fi and bluetooth capabilities. The card also has an HDMI connector for using a TV as a computer monitor.

   There are four USB connectors to accommodate external devices. The computer uses a SD memory  card for memory, similar to a hard drive in a standard size computer.
   The software is a semi-proprietary operating system derived from Debian Linux and is called Raspbian Jessie. The card is a popular training environment for young people.
   In this context, the card is used to monitor and control the solar panel array. Scripts in PHP and Python languages read analog-to-digital converters connected to panels and get voltage and current measurements. These allow tracking of power output, power usage, and sun location.
   Data is deposited in text files in csv format for use with spreadsheets. This is also useful for making charts of daily solar activity. There are other options for data manipulation. The D3 javascript library can create web (HTML) pages of the tabulated data and save the files to disk. SVG images can also be created and saved.
   The image shows the pin functions for the Pi.
   The Pi can issue commands to control a linear actuator which can adjust the position of the array with respect to the sun.

Residential Solar Power Station - begin

This is the first entry in my solar power blog. The subject will be solar power in a residential setting. My house, specifically.
   The people who will benefit most will have a post secondary education. Solar energy is a science intensive subject. Math is important but not a critical need.

   The station is composed of :
1.) solar panels
2.) the hardware which holds them, frame included. Referred to as the 'array'.
3.) the the array is connected to the indoor electronics by PV cable using MC4 connectors.
4.) the cable enters a charge controller. The controller regulates the energy going into the batteries. The most efficient controller, and worth the extra expense, is a MPPT (maximum power point tracking) controller.
5.) The controller feeds four batteries for a total of 2,952W, or about three kilowatts of stored energy.
6.) the batteries feed an inverter. The inverter converts battery/panel D.C. voltage into standard household power, 120V.A.C.. The best model is a pure sine wave inverter. The pure sine model most closely approximates the utility electricity in the house. Other inverters use PWM (pulse width modulation) which can run many, if not most electrical equipment. Some rely on the VAC as a timing reference. Some digital clocks use the 60 hertz power signal to measure the seconds in the clock. A PWM inverter will create chaos in the timing. Some elctrical equipment simply requires the clean power provided by a pure sine inverter.

Equipment brand, model list:
solar panels: Solar Fennel/Renogy/Ramsond/HQST
framing : Unistrut, Superstrut
cabling, connectors: generic
charge controller: Epever 3210A MPPT charge controller
batteries: generic 12V, 18aHr sealed gel/ Duracell Ultra Marine 12V,108aHr
inverter: Cotek 1.5KW pure sine inverter

Each of the items in the lists presents its own set of problems in implementation.

Solar panels come in several different chemistries (compositions) and different sizes and power ratings.
The panels I have are, but for one, monocrystaline in composition. The remaining one is polycrystaline. The performance for the two is similar enough that the price differences are worth looking at. Panels for large sites usually range in the 250-300 watt area. Mine are 100 watts and serve in smaller systems, e.g. RV's, trailers, boats, small residential systems. My system is rated at six hundred watts. The panels can be wired up in  many different configurations. Series, parallel, and a mix of both, series-parallel.
   My charge controller is most efficient when wired for a 36 volt panel array and a 24 volt battery bank.
   I wired the panels in two groups of three. The three were wired in series, then the two groups of three were wired in parallel. Panels usually come with small utility boxes on the back with connecting cables in  place.
    The charge controller is an Epever 3210A 30A controller with UART communications with Modbus protocol in an RTU format. I've written a programming script in the PHP language that reads registers in the controller and prints the data to a text file in spreadsheet (CSV) format. The software is installed on a Raspberry Pi 3B computer board. The Raspberry Pi (RPi) is a small, but powerful and versatile computer the size of a shirt pocket. The RPi is connected to the controller with a USB to RJ45 cable. There is also wi-fi on the computer that allows me to access the board from my laptop, phone, or the internet.
   The webpage to access the data over the web will be a PHP script or HTML page that uses D3 charting tools, or similar, to present the data in a way I consider most easily digested and making all the data I think relevant available.
   Major difficulties have been encountered in the mounting framework. My installation is ground mounted and one, or hopefully, two axis tracking. The tracking of the sun's position is another way to improve the efficiency of the system. A linear actuator will control axis movement in one direction, typical elevation/altitude. Another will control movement in the second axis, typical azimuth.
   Most systems are mounted on rooftops and are fixed. Many are fixed but mounted on the ground.
Remember, we're discussing residential and smaller systems here.
   Tracking systems involve more sophisticated, and therefore, expensive hardware. Unfortunately, the technology in this area lags extremely far behind the rest of the residential solar power station.
   There are several approaches to designing and building the hardware for a tracking array. I took a slightly different approach. Mind, I am prepared to change my approach at the drop of a hat if new technology becomes available, and I'm not committed by way of previous purchases or agreements.
I have a steel pipe leaning at about forty-five degrees and facing South, This is about optimum for my latitude. The panels are mounted on some steel struts. The struts are mounted on the pipe using pipe clamps. The top of the pipe has a tee fitting and the bottom has a cap. There is enough freedom in rotation that the extra rotational movement takes the place of bearings. Reminds me of the Archimedes screw pump. The bottom cap will be fixed in position as will the tee fitting at the top. The pipe will rotate to move the array in a way that follows the sun's path. Tee fittings at the top and bottom would allow adjustment of elevation. Both ends will be anchored to four inch posts of treated lumber embedded in or attached to the tops of, concrete bases or pylons. This will also raise the array into the air and increase sun exposure time.
.   Trees and brush on my and surrounding lots need to be removed. This will take dealing or a visit to a court.
 I have prepared scripts written in the Python language that will calculate the sun's position mathematically.  I have also constructed a small device composed of four small solar cells. The cells are mounted on a sheet of metal in the shape of a cross of the kind associated with medicine. The cells, square in shape are glued, one on each arm of the cross, with silicon caulk. The arms of the cross are bent back so that when the center square of the cross is aimed toward the sky, the voltages of the cells, taken as a group, will indicate the direction in which to move the array. One method acts as a backup for the other.


30Ax36V=1KW, the rated power of the controller as set up. I may use a 48V setup and increase the rated output but lose some efficiency. The rating would be 30Ax48V=1.44KW. Moving to a larger controller would be in order above one klowatt.


February 2025 update

 Over a year ago, a lightning strike destroyed or damaged most of my solar power station. Only the panels were spared. (except for one). The...